| Main Description |
The more complete description can be found here.
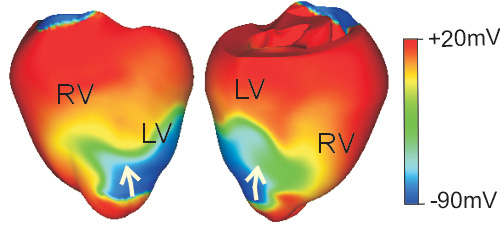
Results from the Tulane whole ventricular model showing reentrant activity in the ventricles with
transmembrane potential distribution on the anterior and posterior epicardial ventricle surfaces. RV and LV refer to
right and left ventricles and arrows show the direction of wave propagation.
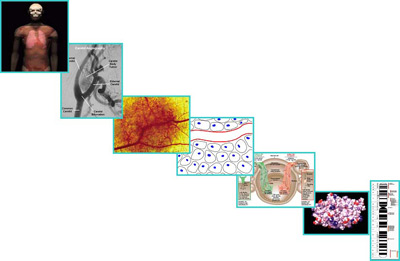
From DNA to whole organism modelling
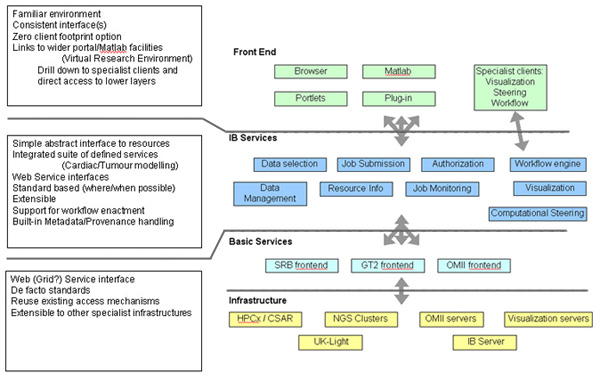
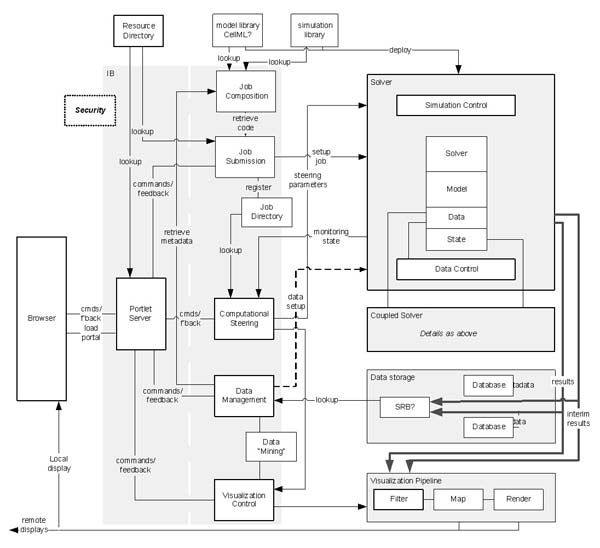
The 5 main components of this architecture are:
-
the user interface which runs within a normal web browser on the user's machine as a minimum requirement or via a
desktop application such as Matlab;
-
a set of infrastructure components providing user-accessible services including job preparation, submission and
monitoring, computational steering, managed access to data and control of visualisation;
-
the simulation subsystem which provides a range of solvers for user-supplied model codes, possibly running in
coupled mode;
-
the data management subsystem which stores the user's data files along with associated metadata and provides
facilities for data retrieval and curation; and
-
the visualisation subsystem which offers the user a range of visualisation techniques for examining simulation and
experimental results, possibly working collaboratively with remote colleagues.
|
